Baseline Ecological Monitoring
N4C has been conducting Baseline Ecological Monitoring at a number of sites in the catchment. The goal of this work is to be able to track long-term changes in the catchment, to gauge the effect of our work and the effects of development or other events. It’s one of many citizen science projects going on around the country: projects that collect useful data by getting members of the public involved in finding out about nature in their local area.
You can also check the pages for the project sites where we have carried out monitoring:
- Moorhen Flats
- Arnwood Place
- Bridgewater Creek at Wembley Park
- Greenslopes DCP
- Bowie’s Flat
- Glindemann Park
Acknowledgement
N4C would like to acknowledge the past support of Brisbane City Council through the Lord Mayor’s Community Sustainability and Environmental Grants Program for our Baseline Ecological Monitoring project.
Current methodologies
N4C uses our own version of “Rapid Appraisal of Riparian Condition” (RARC) to assess riparian vegetation. This method was presented by BCC’s creek catchment program as part of Waterway Health Assessment training. N4C then adapted RARC for our catchment with the help of two Griffith Uni community interns and a member who is an Ecologist. RARC is a different method of collecting data than our previous methodology, but it is better because it relies more on measurements and less on estimation or expert knowledge.
We are hoping that different catchment groups might use the same methodology, enabling comparisons between catchments. The information gathered can also be stored in a central location. Have a look at the field sheet and detailed methodology guide to learn more about it.
Riparian transect results for 2017 and 2018 can be found here.
See the Vegetation page for more info.
Bird walks are undertaken at irregular intervals throughout the year. Data on bird species abundance is now best stored by uploading it to eBird, the international website for recording bird sightings. See also our Birds page.
We have also been doing physical/chemical water monitoring approximately twice a year and uploading the data to Healthy Land and Water’s Community Water Quality Database.
If expertise is available, we may extend our ecological monitoring to include other indicators such as macroinvertebrates and fish surveys.
Previous methodologies
From 2015 to 2016 we used our previous field sheets to collect data at seven sites about:
- Plant species present and their abundance (2015 only)
- Structure of the plant community
- Bird and reptile species (by observation only)
- Biocondition (tree, shrub and groundcover, species richness, recruitment of tree species, erosion, habitat resources such as logs & termite nests etc)
- Spatial data (using GPS to map particular habitat areas and key features of the creek)
You can find links to the data sheets from our previous method below.
Glindemann Park 2016 and 2015
- Arnwood Place 2016 and 2015
- AP Data sheets 2016
- AP Data sheets 2015
- Map of sections for monitoring survey 1.6MB
- AP Web-based map 2015 Prepared by Paulina Lee
- AP Report on Monitoring 2015
- AP Habitat areas 1.6MB Map prepared by Paulina Lee
- Birds at Arnwood Place: Native vs Exotic
- Moorhen Flats 2016 and 2015
- MF Data sheets 2017 – Bird walk only
- MF Data sheets 2016
- MF Data sheets 2015
- MF Vegetation types map 2011
- MF Vegetation types map 2015 Map prepared by Paulina Lee
- MF GPS Data Sheets with map 2015 6.6MB Raw data and map as above
- MF Web-based map 2015 Prepared by Paulina Lee
- Greenslopes DCP site 2016
- DCP Data sheets 2016
- Map of sections for monitoring survey 659 KB Prepared by Paulina Lee
- Wembley Park 2016
- Bowie’s Flat Constructed Wetland 2016
- BF Data sheets 2017 – Bird walk
- BF Data sheets 2016
- Bowie’s Flat 2016 plant species richness Infogram
- Bowie’s Flat is a wetland but does it have more waterbirds or non-waterbirds? BF Birds 2016 Infogram
- Leicester St Park 2013
- Bird Walk data spreadsheets
- CC Data sheets 2017 – Coorparoo Creek Bird walk only, 18th June 2017
- Other data from N4C birdwalks is contained in the sheets above.
- See also our Bird data page.
- Comparison of sites 2015
Which site had the highest species richness in birds and plants: Arnwood Place, Moorhen Flats or Wembley Park? This Infogram should bring out the competitive spirit in our bushcare group leaders and volunteers!
Future work
We will be revisiting sites each year to monitor progress, especially in the condition of creek banks and in fauna using the sites. Would you like to help type up, analyse and interpret the data we have already collected? Contact us.
Current activities
Our current methodology, a version of Rapid Appraisal of Riparian Condition, assesses various Ecological Values and types of Disturbance and allocates scores to each. This is detailed in our methodology and field sheet.
We monitor 12 transects at 6 sites:
- Moorhen Flats – 2 transects
- Arnwood Place – 3 transects
- Bridgewater Creek at Wembley Park – 3 transects
- Greenslopes DCP – 1 transect
- Bowie’s Flat – 1 transect
- Glindemann Park – 2 transects
Results can be viewed in the ongoing spreadsheet, with selected snapshots displayed below:
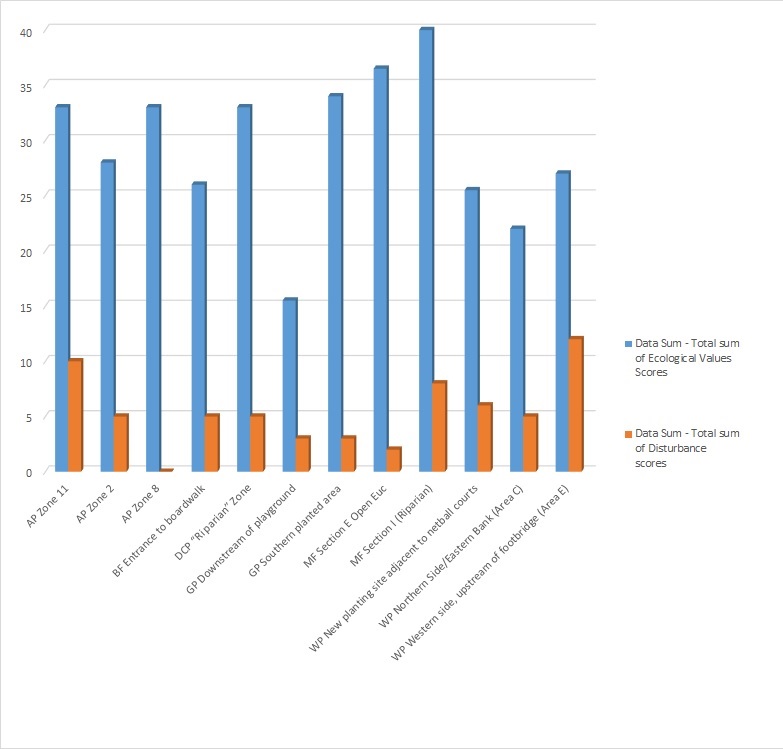
Comparison of all transects 2017:

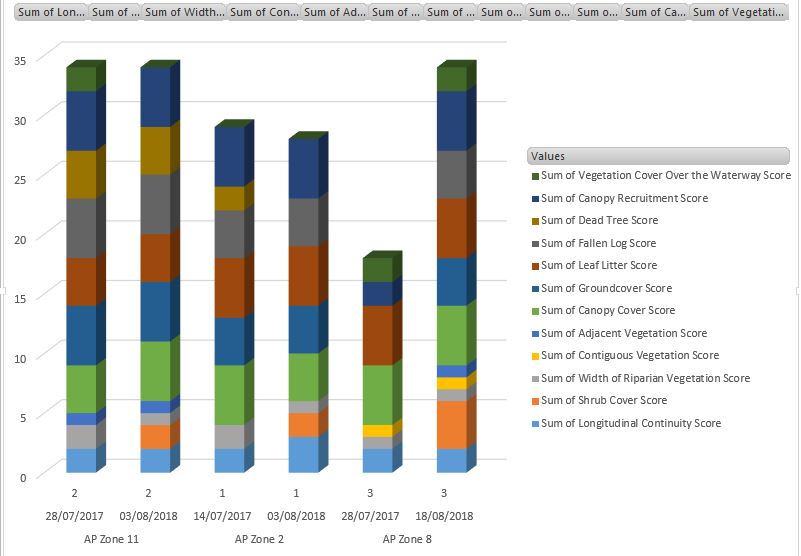
The scoring system also allows for more detailed analysis of what is contributing to a higher or lower score at a transect. Charts like this will be added to the project pages of each of the monitoring sites, but here is an example at Arnwood Place in 2017 and 2018:
Previous vegetation monitoring
See our 2015-2016 data sheets on the Methodology page.
Current activities
N4C conducts irregular bird walks around our catchment – keep an eye on our Facebook page or on your member emails for details of them.
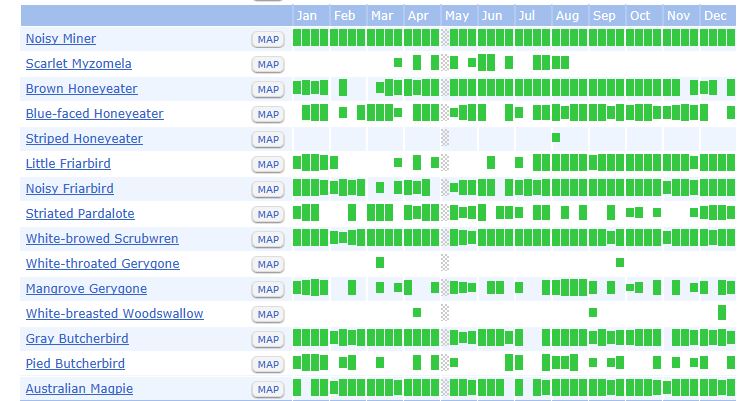
Bird sightings are best uploaded to eBird, where they can be combined with those of other birders including both amateurs and experts. You can click on Explore on the site to see what birds have been recorded at locations around the world – including our Ecological Monitoring sites. eBird can even make seasonal bar charts of sightings, allowing you to check what birds are most likely in any month of the year. To upload your own sightings, just join up to eBird – it’s free.
The following table gives an overview of data available (at 18/10/18) on eBird for our ecological monitoring sites. If you’re a birder, why not do some observations at a site that has fewer checklists, like Wembley Park?
| Project Site | Number of species | Number of checklists |
| Arnwood Place Park | 64 | 13 |
| Bowie’s Flat | 64 | 97 |
| Wembley Park | 32 | 2 |
| Greenslopes DCP * | 78 | 35 |
| Moorhen Flats | 104 | 178 |
| Glindemann Park | 23 | 3 |
An example is Moorhen Flats, where 104 species have been seen by eBirders. 176 checklists have been uploaded for the site. Here’s a snapshot of just a section of the bar chart for the site:
Previous bird observations
2015 and 2016 sightings are also recorded in the spreadsheets for those years for each site – see our methodology page.
Water quality monitoring
Approximately twice a year, N4C conducts water quality monitoring at various sites throughout the catchment. This data can then be used to make inferences regarding the ecological health of these waterways. Once calibrated at QUU laboratories, a Horiba multi-probe is used to measure temperature, pH, salinity, dissolved oxygen, oxidation potential and turbidity of the water. These chemical conditions are vital to maintaining life support systems and dramatic fluctuations can foreshadow environmental degradation. Results are then stored on the SEQ Community Water Quality Database which was initiated by Healthy Land and Water, and developed by EnviroComs.
By collecting long term data, this allows catchment volunteers to see the positive impact bushcare projects are having on water quality or help to guide mitigation strategies. With more frequent monitoring, we could establish a greater baseline knowledge of the water quality, thus expanding our awareness of how local climatic events or urban development influences the creeks’ health. If you enjoy being outdoors, visiting unique riparian habitats or want to expand your skills in scientific methodology, feel free to contact us and get involved.
Sites:
- Arnwood Place
- Bridgewater Creek at Wembley Park
- Leicester St Park
- Greenslopes DCP
- Bowie’s Flat
- Glindemann Park
The following graphs provide a visual representation of some of our results. High turbidity readings would require investigation of inflows upstream of sampling point. For example it is possible that in March 2019 turbidity at DCP and Arnwood place were affected by TMR works in Ekibin Creek. Dissolved Oxygen may be affected by this.
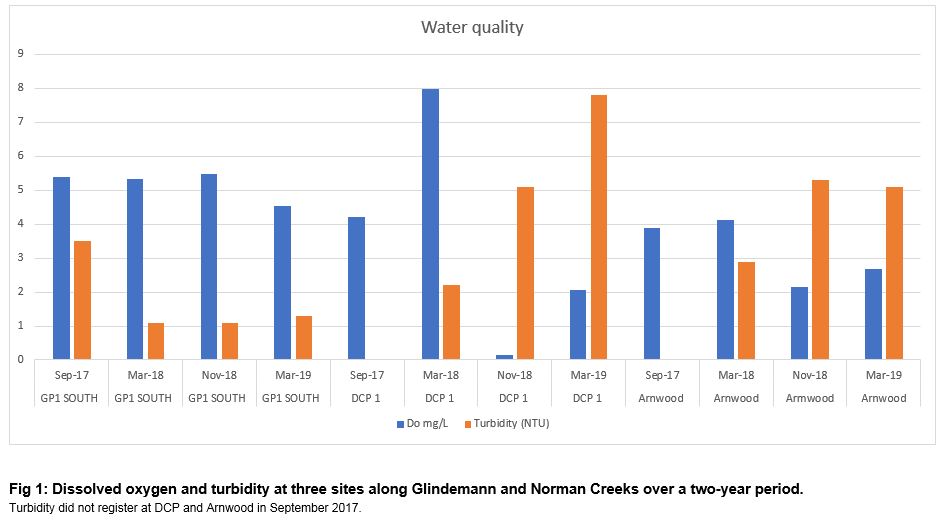
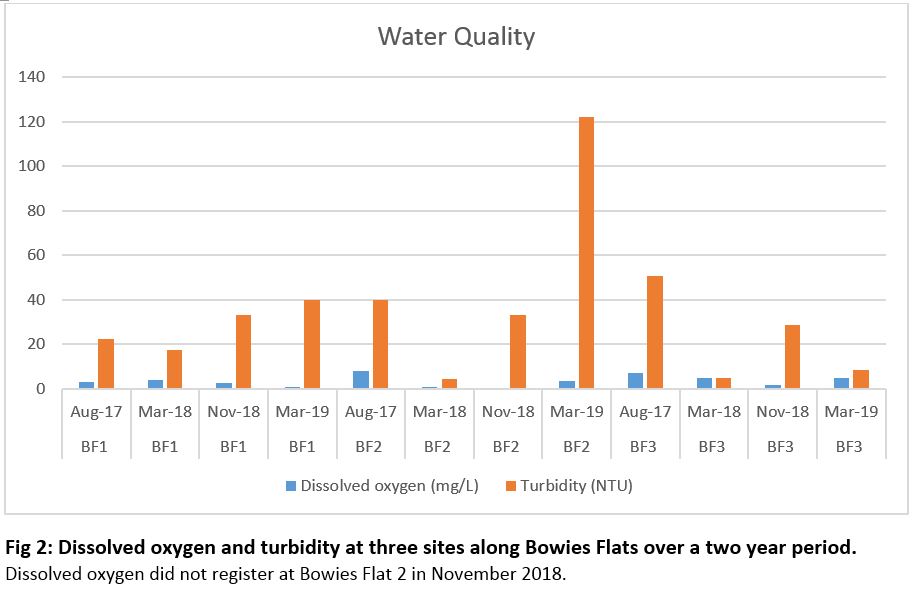
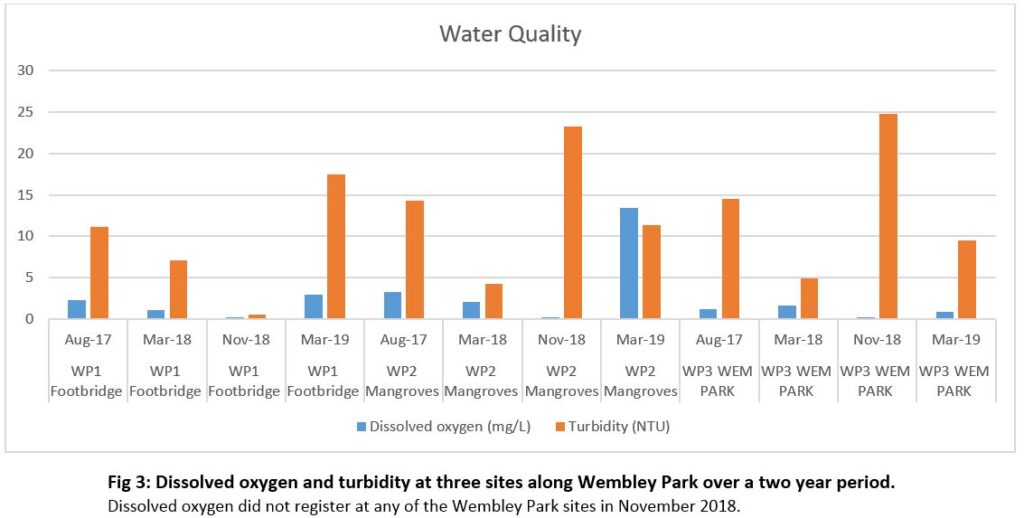
March 2019 turbidity was affected by the works at Bowies Flat, which is upstream of Wembley Park. However, it is not clear what influened the high turbidity readings in November 2018.
Our full spreadsheet of results is available here. (27kb)
Guidlines for interpretation of results are available here. (588kb) Similar guidlines by Urban Utilities SEQ can be accessed here
Other monitoring indicators
If there is expertise and interest we may at times monitor indicators other than vegetation, birds and water quality.
Macroinvertebrates
Macroinvertebrates or waterbugs may be sampled and identified to the level of taxonomic order, to give an indication of water quality. Qld’s Department of Environment and Science has provided some background information about this.
Our sister catchment group SOWN has posted a guide to Macroinvertebrate identification, which is part of the 444-page Qld Community Waterway Monitoring Manual
Fish
N4C members have attended a fish trapping and ID workshop through BCC’s Creek Catchment Program, so if there is interest we could organise one or more fish trapping sessions. A guide to identifying many native fish species can be found on the Moggill Creek Catchment Group’s Native Fish page. It was prepared by Aquatic Ecologist, Dr Tim Howell, initially to assist volunteers participating in the Moggill Catchment Creek Health Monitoring Program.
Mammals and reptiles
Reptiles may be monitored by observation in warm weather, while most mammals may be best observed at night. Trapping would increase the number encountered but would require a permit.